Nov 11th, 2010: Update 4 – EOD
Posted by pugsma on November 11, 2010
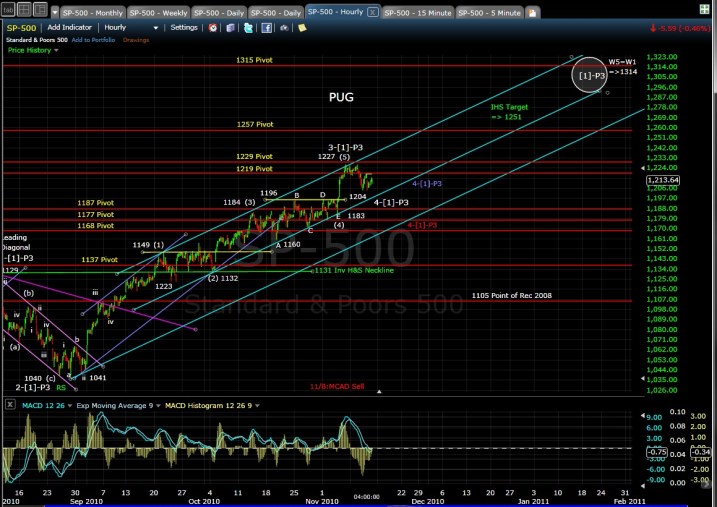
5:15 pm EST: Today the SP-500 saw a re-test of the 1204 low set on Thursday. The SP-500 dropped to 1204.49 to remain just above the 1204.33 low for Thursday. It should be noted that the DOW-30 and Nasdaq did make lower, lows today. This is a negative divergence with the SP-500. Also we saw a lower, high made at 1215.45 vs 1218.71 on Thursday. The SP-500 is in a clearly defined downward channel since the Nov 5th high of 1227.08. Everything that has happened since that high looks corrective. I believe 1227 was the top of minor wave 3-[1]-P3. It fits on a number of levels (i.e. minor W3=1.62W1, Minute wave (4) triangle target, etc.). Thus the SP-500 has been in a minor wave 4-[1]-P3 correction since Nov 5th.
If anyone tells you they know exactly what this corrective mess is off the 1227 high, they are full of … , you get the idea. I do however have 3 counts that look reasonable for the correction. We know that minor wave 4-[1]-P3 should be a complex corrective (i.e. double or triple ZZ, triangle, etc.) to satisfy the rule of alternation with minor wave 2-[1]-P3 that was a simple Zig-Zig (ZZ) down from 1229 to 1040 back in August.
Primary count (white): The SP-500 is tracing out a double ZZ, with wave c-(y) of the second ZZ headed towards a target area of 1196 to 1200 that should be hit tomorrow or Monday. This count would fall to near the mid-channel line of the long upward channel shown on the 60-min chart. Any break above Thursday high of 1218.71 will invalidate this count.
Bullish alternate count (blue): The SP-500 is tracing out yet another ascending triangle. The (a) wave of the triangle was put in yesterday at 1204.33 and we are working on a (b) wave up to the 1227 top of the triangle. This count will play-out between 1227 resistance and 1204 support over the next two weeks. The key to watch with this count is that the (a) wave low of 1204.33 has been put in, and it should not be breached to remain a valid count.
Bearish alternate count (red): The SP-500 is tracing out a triple ZZ that will occur once the second ZZ completes and should target the 23% retrace (of 3-[1]-P3) area of 1184 over the next 2 weeks. This will play-out in the declining channel with lower, highs and lower, lows continue to be made. Again a break above 1218.81 invalidates the double and triple ZZ counts.
SP-500 5-min chart (EOD):
SP-500 15-min chart (EOD):
SP-500 60min chart (EOD):
Sorry, the comment form is closed at this time.


You must be logged in to post a comment.